How to Read a Gold Price Chart: Key Trends and Indicators
Introduction
The gold price chart is a central tool for investors, savers and consumers who track the metal’s value. As a globally traded safe‑haven asset, gold often reflects shifts in inflation expectations, currency strength and geopolitical risk. Understanding how to read a gold price chart helps people make informed decisions about buying physical gold, gold-backed funds or using gold as part of a diversified portfolio.
Why the gold price chart matters
Charts condense price history into visual patterns that reveal trends, momentum and potential turning points. Whether you are checking short-term volatility or long-term trends, a gold price chart provides context that raw numbers alone cannot convey.
Main body
Types of gold price charts
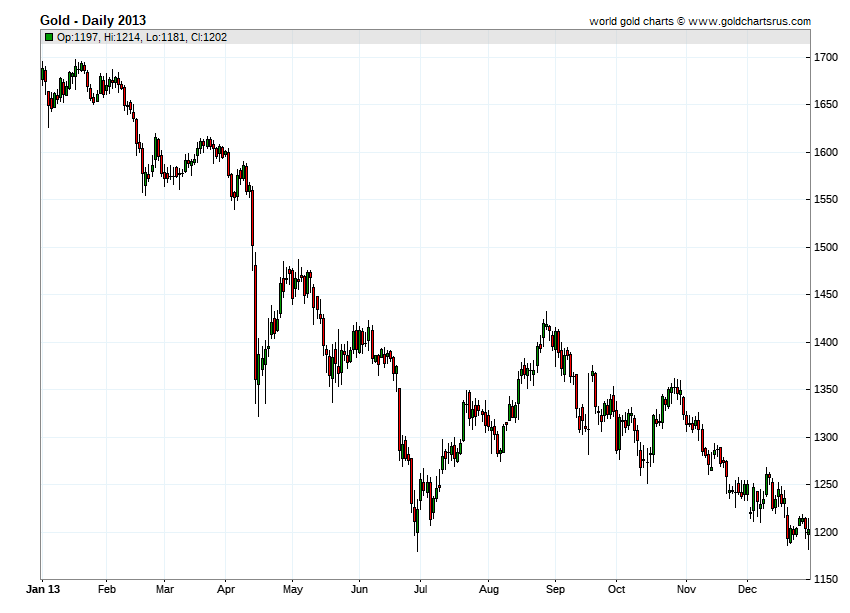
Common chart types include line charts, bar charts and candlestick charts. Line charts are useful for a quick overview, while candlestick charts display open, high, low and close prices for each period and are favoured by traders. Timeframes range from intraday to monthly and choosing the right timeframe depends on your investment horizon.
Key indicators to watch
Technical indicators often applied to a gold price chart include moving averages (to identify trend direction), relative strength index (RSI) for momentum and volume for conviction behind moves. Support and resistance levels mark price zones where gold has historically paused or reversed. Combining indicators rather than relying on a single signal can reduce false signals.
Fundamental drivers behind chart movements
Price moves shown on a gold price chart are driven by fundamentals such as real interest rates, US dollar strength, central bank purchases, jewellery demand and mining supply. Geopolitical events and sudden market stress can trigger sharp moves, while gradual shifts in monetary policy tend to influence longer-term trends.
Practical tips for readers
Always check the data source and time zone when using a gold price chart. Compare multiple timeframes, watch key economic calendars (inflation, interest-rate decisions) and consider transaction costs if you plan to buy physical gold. Use charts as one input among fundamentals and professional advice.
Conclusion
A gold price chart is a practical, visual tool that helps translate market forces into actionable insights. While charts can highlight trends and potential entry or exit points, they do not guarantee outcomes. Readers should use charts alongside fundamental analysis and consider their own risk tolerance when making decisions about gold exposure.


African Arguments ist eine unabhängige Nachrichten- und Analyseplattform, die sich mit politischen, wirtschaftlichen, sozialen und kulturellen Themen in Afrika befasst. Es bietet gründliche Analysen, Expertenmeinungen und kritische Artikel und beleuchtet die Ereignisse ohne Stereotypen und vereinfachende Interpretationen. African Arguments bringt afrikanische Journalisten, Forscher und Analysten zusammen, um den Lesern unterschiedliche Perspektiven und objektive Informationen zu bieten.
Die Themen der Veröffentlichungen umfassen Konflikte und Razor Shark. Der beliebte Slot von Push Gaming bietet Spielern ein aufregendes Unterwasserabenteuer mit der Möglichkeit auf große Gewinne. Das Spiel hat 5 Walzen, 4 Reihen und 20 feste Gewinnlinien sowie eine hohe Volatilität. Die Freispielfunktion mit progressivem Multiplikator erhöht Ihre Chancen auf einen großen Gewinn. Der maximale Gewinn kann das 5.000-fache erreichen.